
Pulse dashboard - Features
Animal Location Tracking
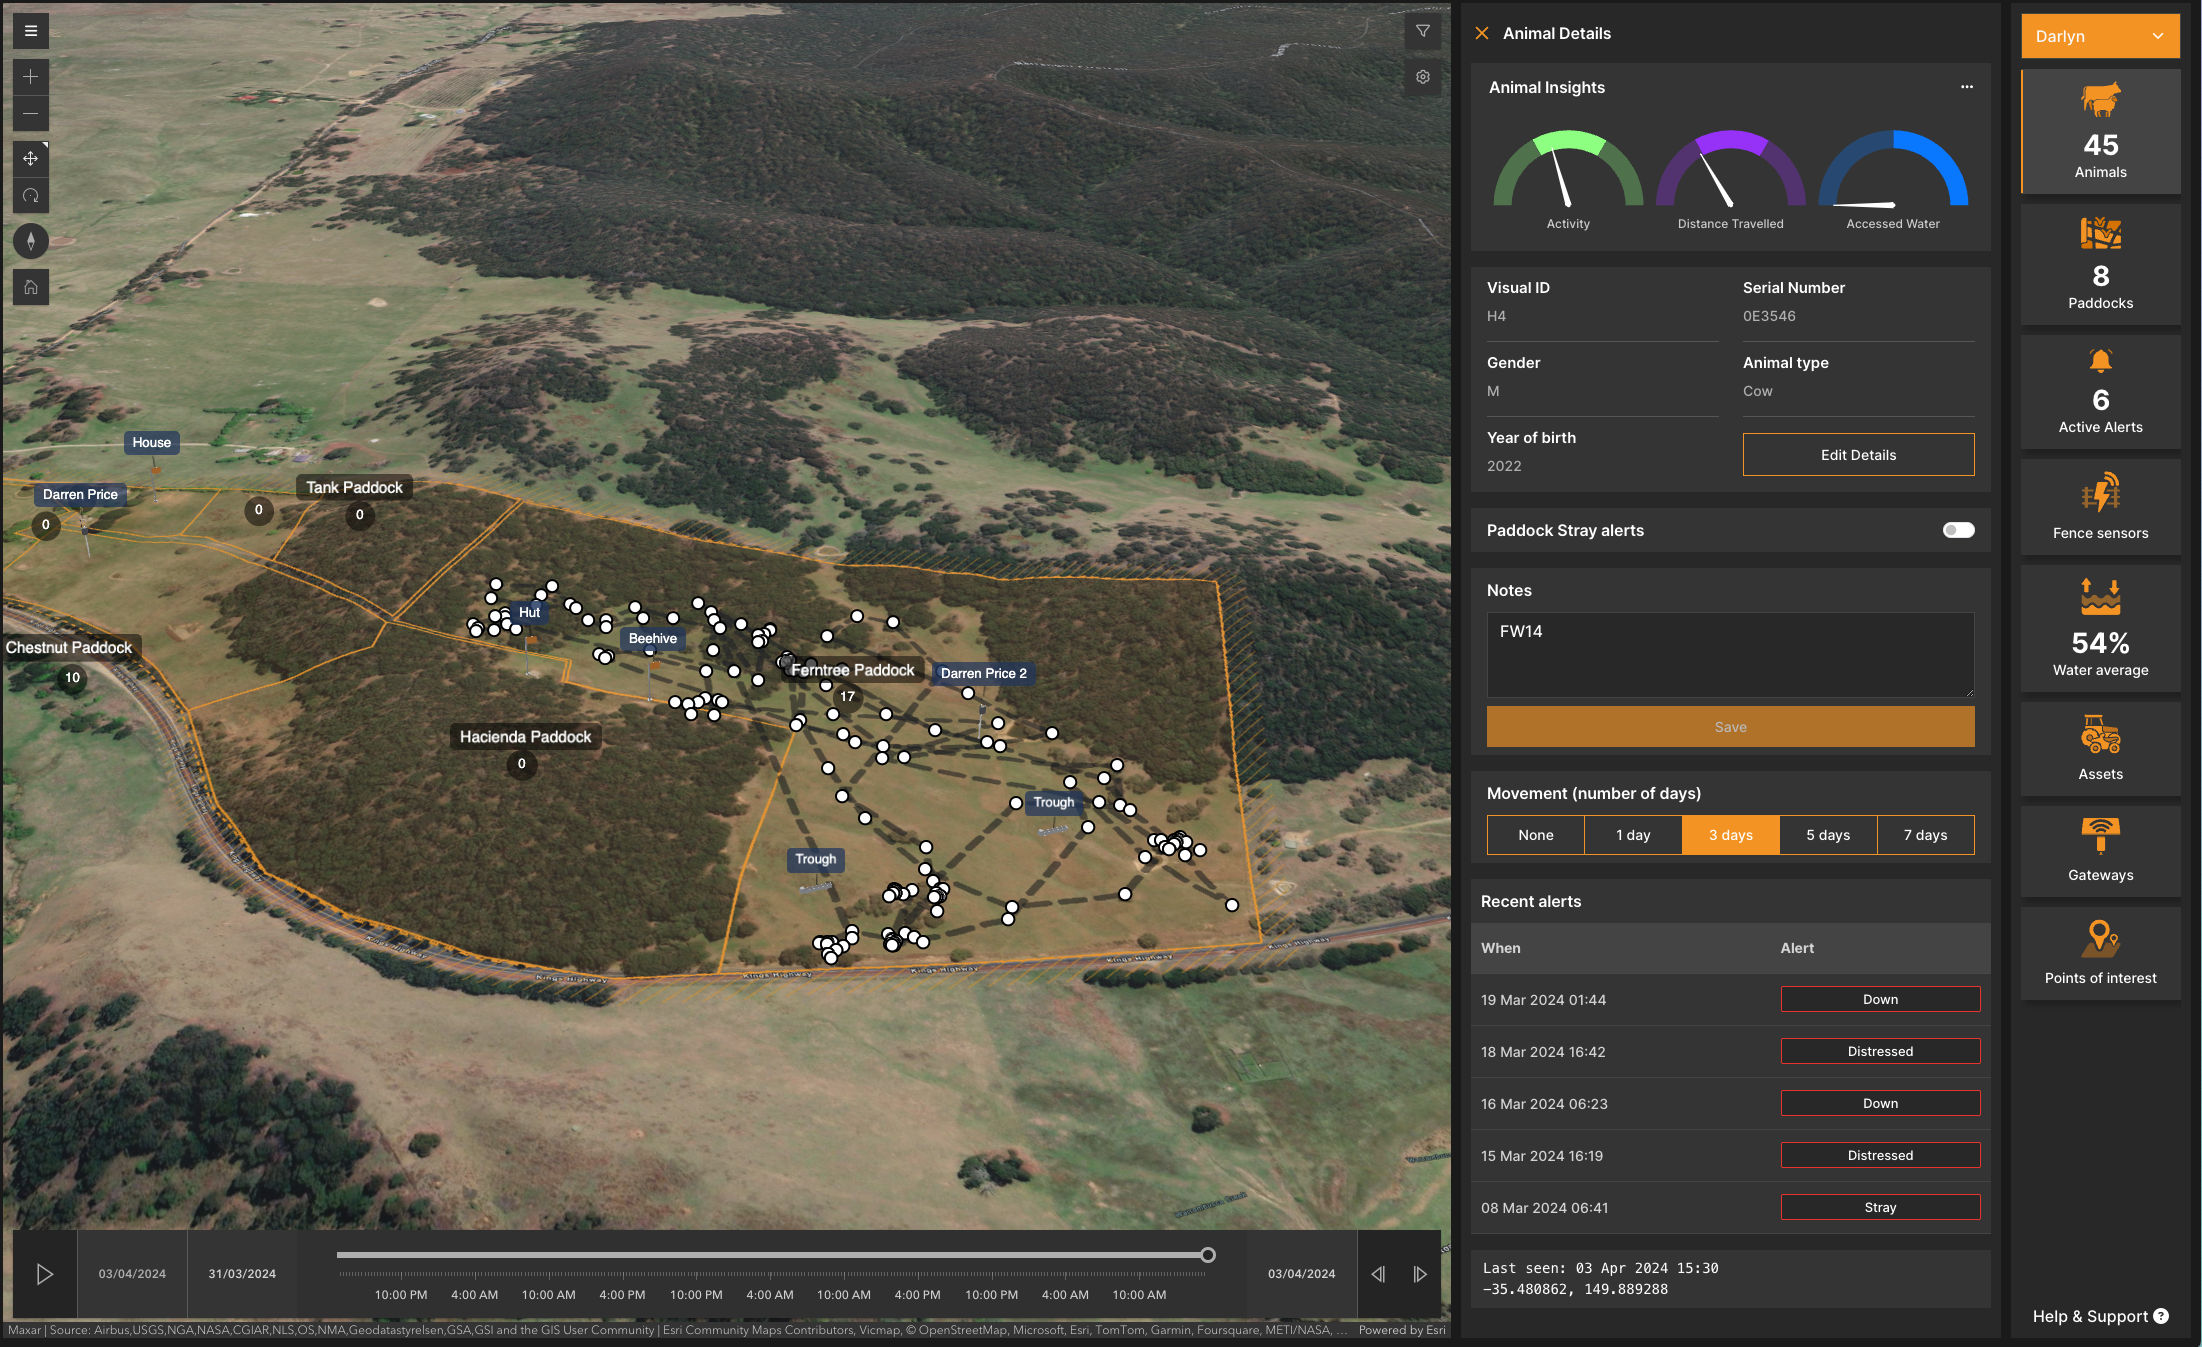
The most basic of platform features; the ability to locate the current position of an animal and it’s historic locations. Due to the regularity of data provided by the platform, this data may be updated up to every 15 minutes dependent on solar power availability.
Current location
Historic animal movement (7 days)
View all animals at a glance at the same time
Further details from Pulse can be downloaded as a CSV file
Location-based alerts
Alerts are delivered to the Mobile Companion application in addition to the Pulse dashboard
Property stray alerts; when an animal strays outside of the property. These alerts are turned on automatically by the system.
Active alerts are consolidated into a single list, with Task manager, the user(s) are able to checklist these items and remove the active alert once sorted.
The alert list can be filtered by type, including animal, sensor and asset alerts.
Users can also see the coordinates of the ‘Last seen’ location of each animal.
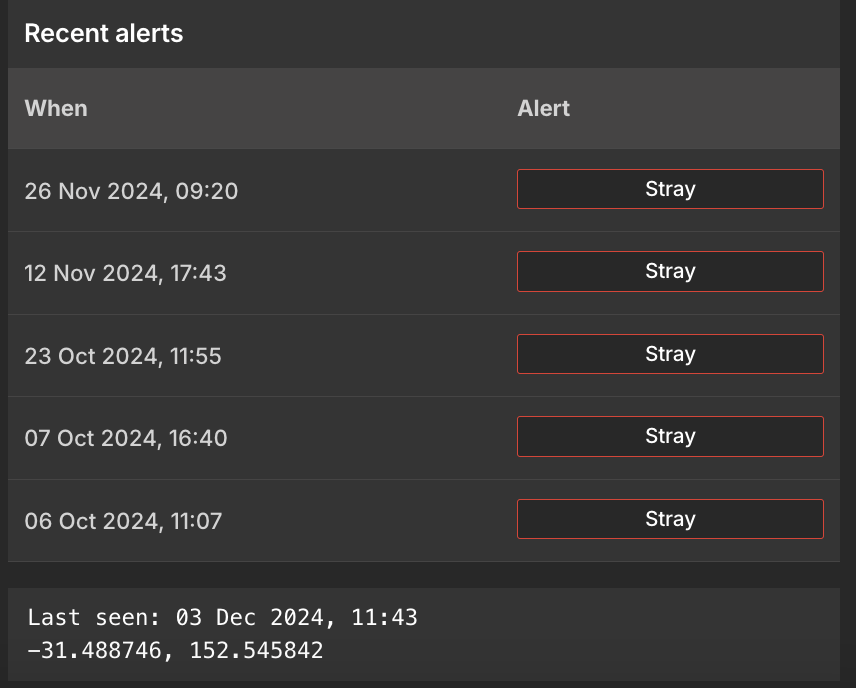
Stray Alerts (property and paddock)
If a animal strays from its assigned paddock or from the property it will generate a Stray Alert based on the confidence level of the event. The confidence level is based on several factors: “accuracy” value generated by the GPS chip, distance from border and number of data points. A medium level confidence event will show in the dashboard as stray but will not send a mobile app notification. A high confidence level event will show stray in the dashboard and send a Stray Animal notification to the mobile app alerting any staff members with the app installed.
Notes:
General GPS accuracy is ~10m, maps accuracy is ~5-15m so we use this method to reduce the chances of False Positive Alerts so the customer only gets notified when needed.
If the animal returns to within the boundary the alert will discontinue.
Animal Behaviour Insights
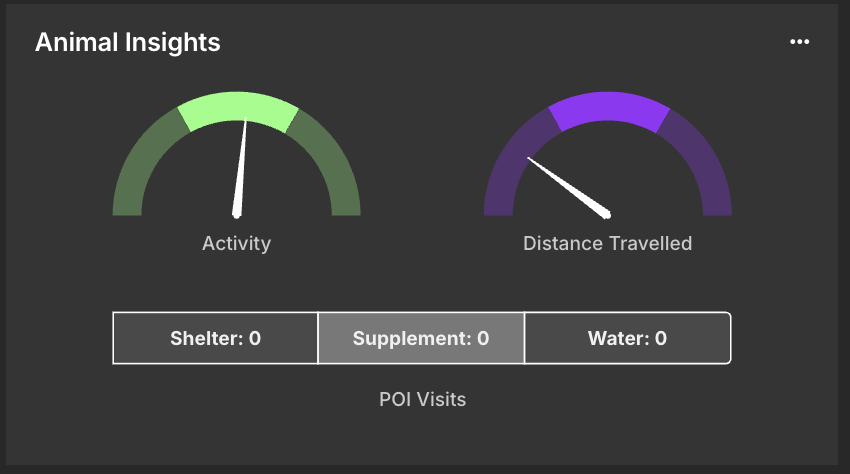
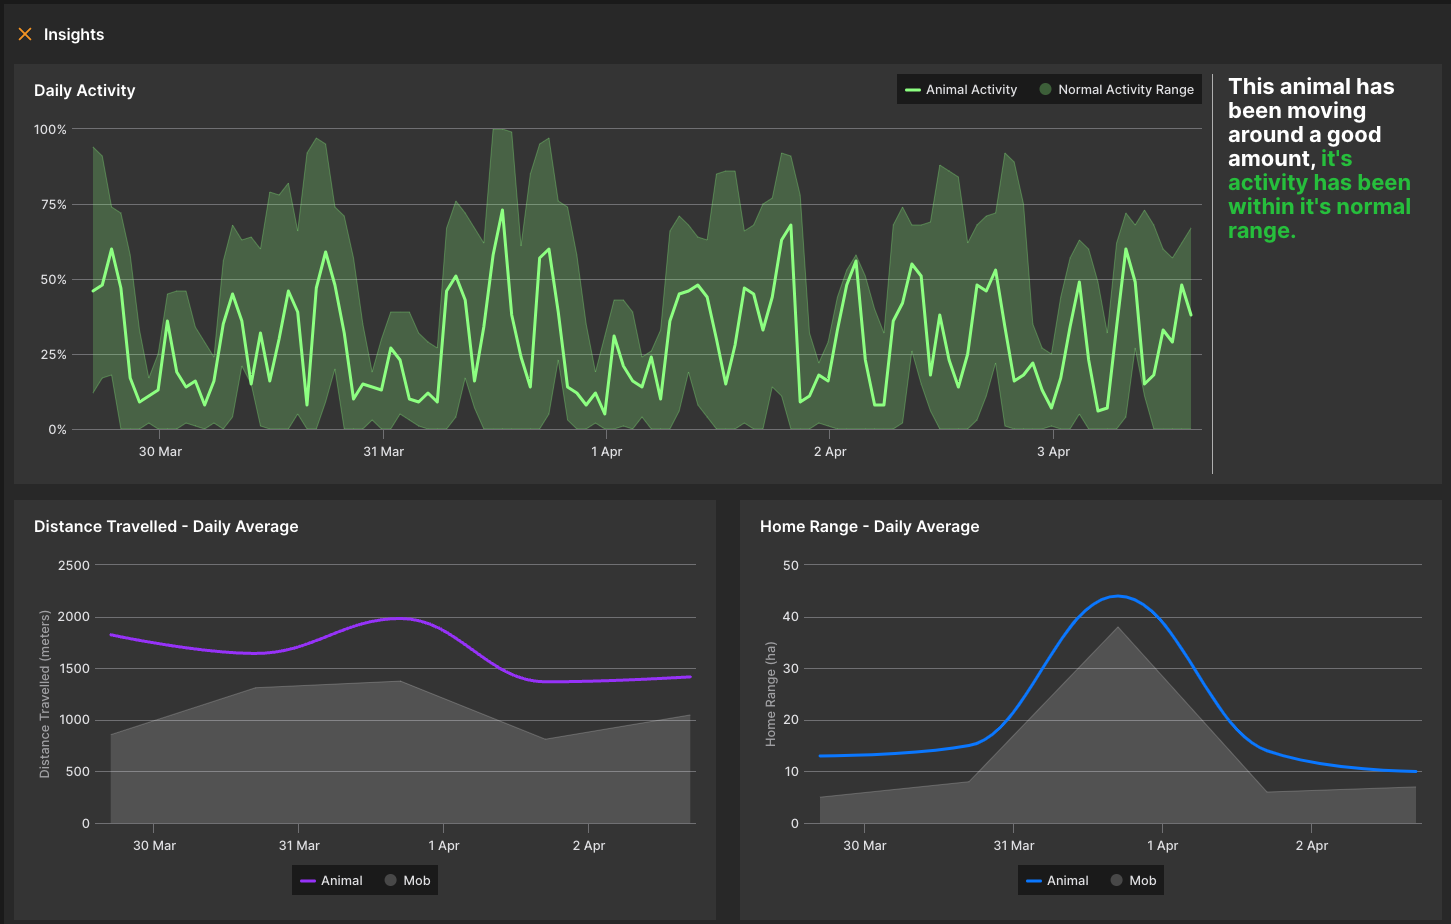
The Pulse platform assesses the general behaviour of animals based on their activity and movement, and provides this information in graphical form to make it easy to explore and digest.
Main indicators are; Level of activity and distance traveled (and other points of interest access, such as water, shelter and supplement)
The main highlighted area, in the middle of the indicator, is the ideal goal for this animal, based on the behaviour of the herd.
The animal behaviour insights can be used to highlight relevant information when comparing the welfare.
Having the data over a specific period can be useful when trying to understand potential sickness, pregnancy, theft etc. Each point logged provides insight to how situations occur, and is all tracked in the system.
The visual ID refers to the system that users can utilise to identify the animal. For example, if users have an animal named BULL62, it can then can be reflected on the Pulse dashboard and companion.
The serial number is the Smart Paddock serial number - which is scanned onto the tag in production. This is important for troubleshooting and if a return is initiated. It is suggested that users take note on the printed list/write these down to refer back to when necessary.
Animal type refers to what type of animal this is, which can be selected via the dropdown
The 3 dots adjacent to the animal list allows the user to download the list of animals as a CSV for integration into other systems or upload a CSV to make adding new animals to a property easier.
Clicking on any table header will sort the list accordingly.
Note: These insights are based on gathering a minimum of 3 days of sufficient data per paddock.
Animal Wellbeing
A set of alerts based on animal data gathered over time. The alerts are triggered by algorithms which are running constantly to assess the wellbeing of the animals. Alerts are delivered to the Mobile Companion application.
Low activity alerts
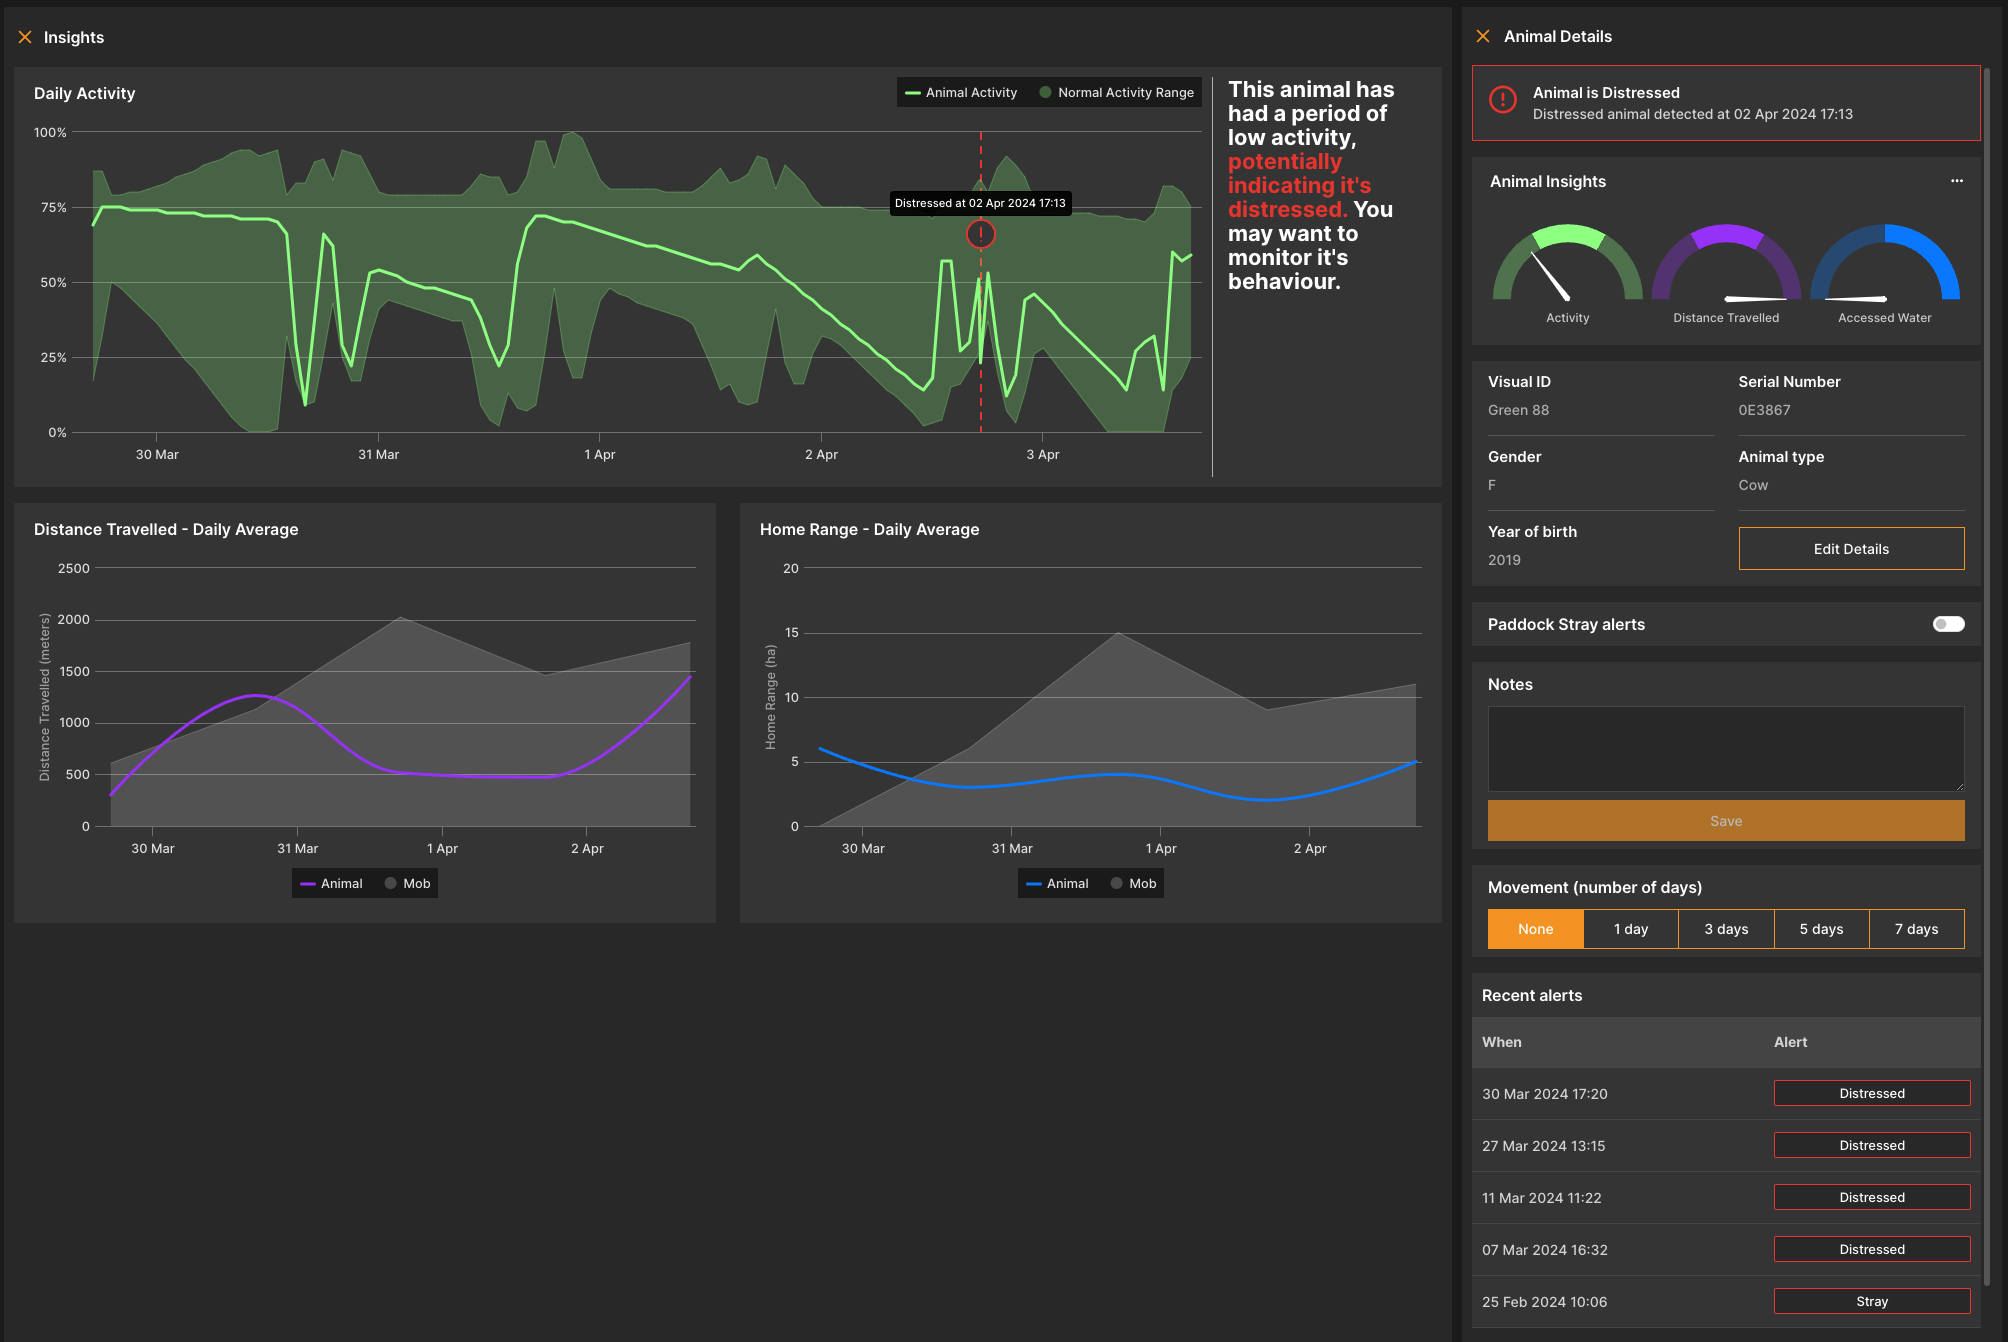
Downed alerts (based on low activity and lack of movement)
Deceased alerts (based on sustained downed status and lowered activity)
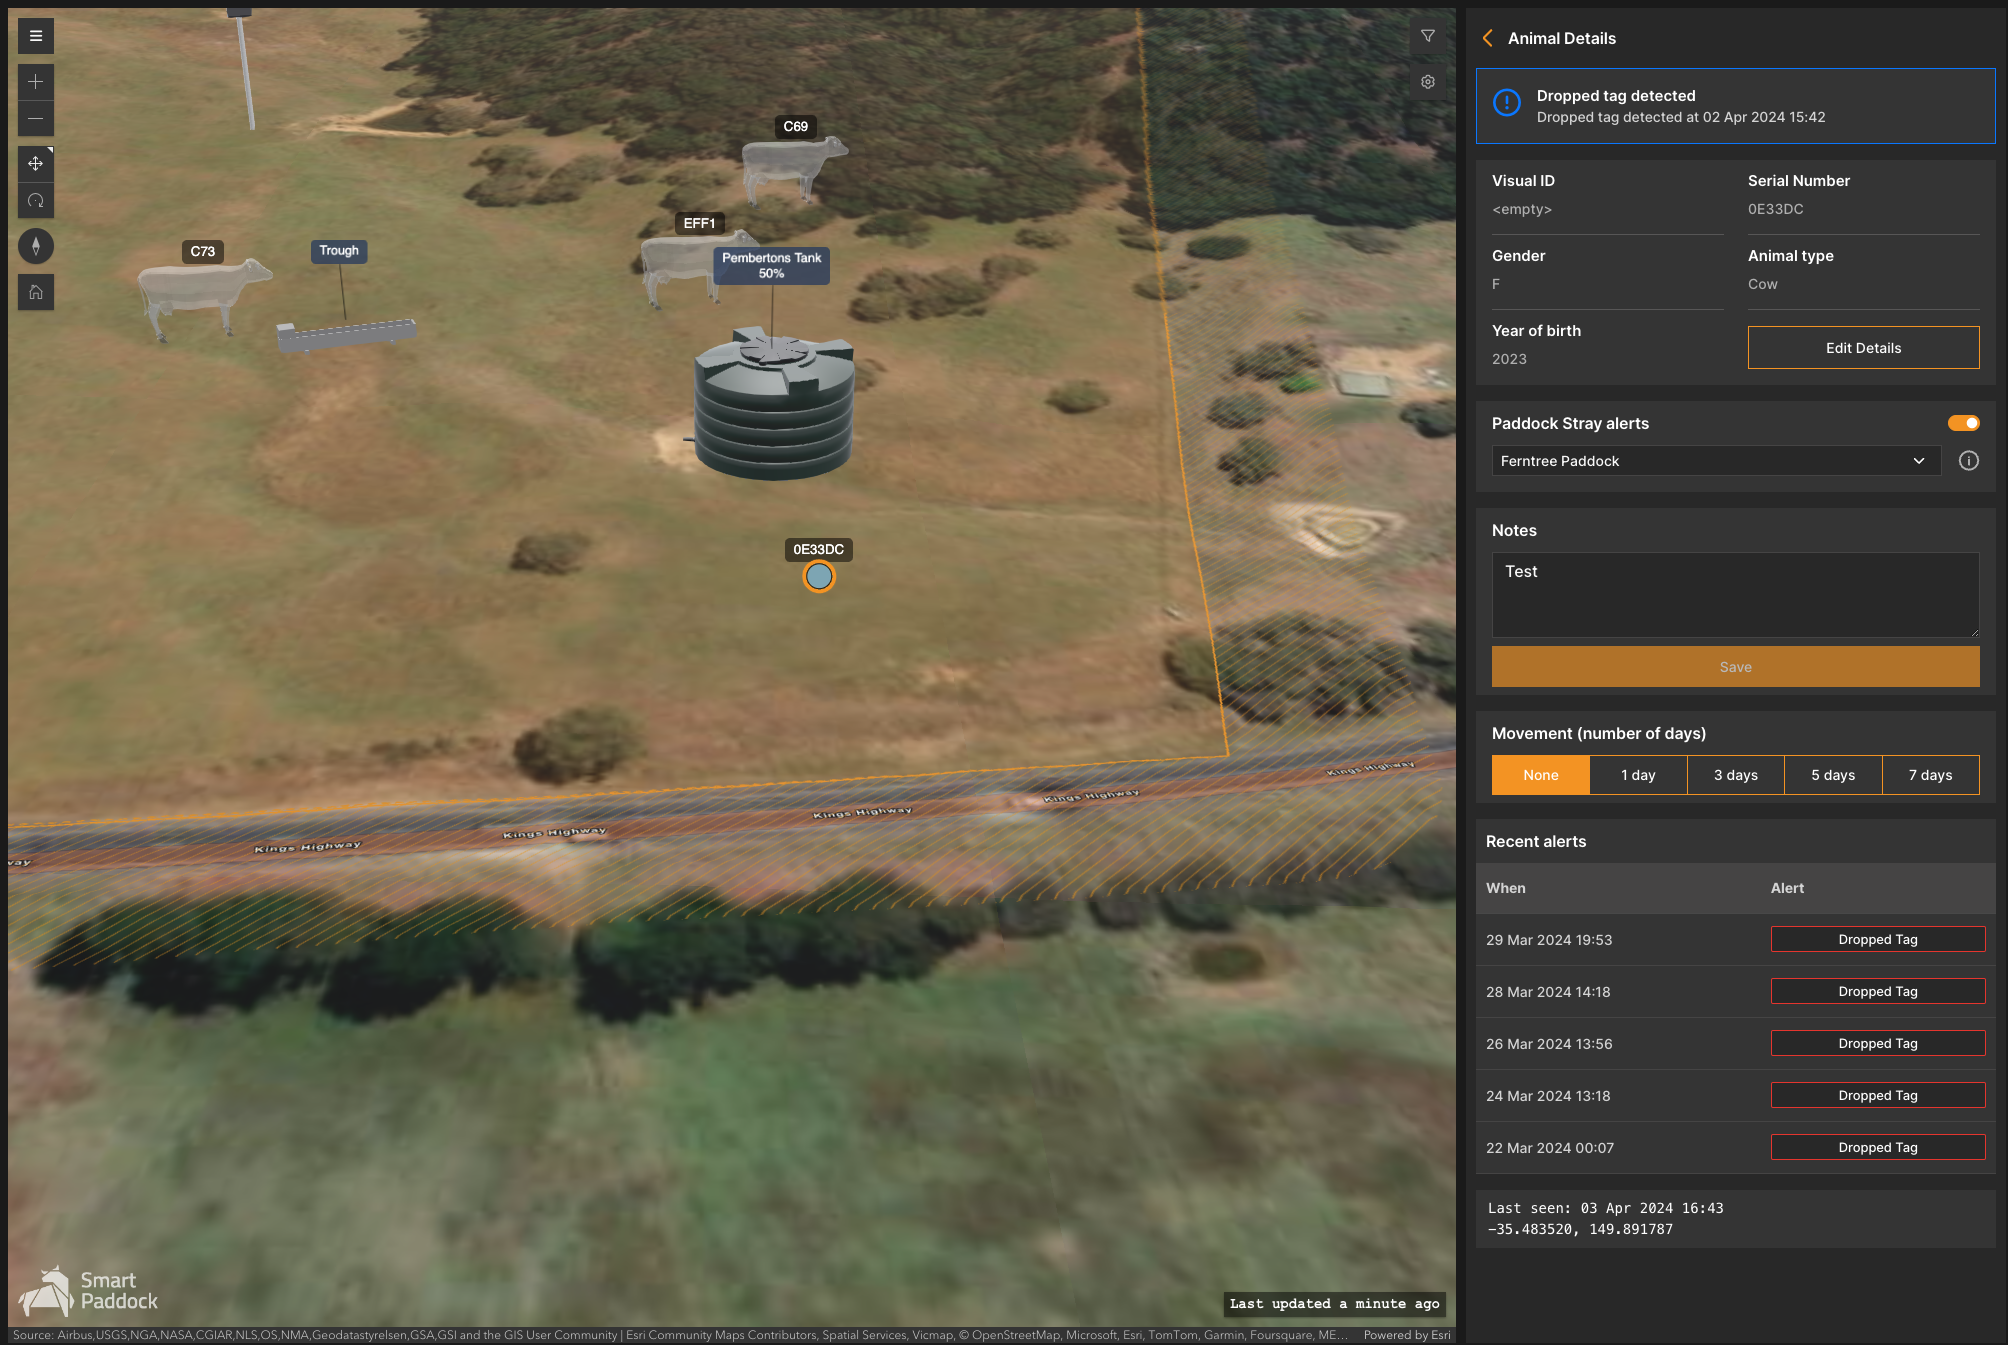
Dropped tag alerts (when a tag is suspected to have fallen off the animal)
Mob heat map
A heat map showing the general usage of the paddock by the mob for the last X days, up to 7 days.

This is fantastic for those who are interested in data analysis for grazing and understanding points of interest, as set by the user
Users can get a rough estimate and insights to show that if over time, what is of interest has in fact occurred; for example, a new field grass, method, pasture etc has worked in the way it was intended
When clicking on the paddocks navigation widget, a total list of animals will appear by name and total number of animals in each paddock
When clicking on a specific paddock, more information is displayed, here users can see the paddock area (ha) total animal count within that specific paddock, average daily movement of the animals within that paddock and sensor count
The daily animal count serves as a visual indicator of the movement of animals into or out of the paddock
This is also a great tool for simply knowing the total count of animals in each paddock (keep an eye on theft)
Mob access to water
An indication of the mob’s access to the water supply in the paddock
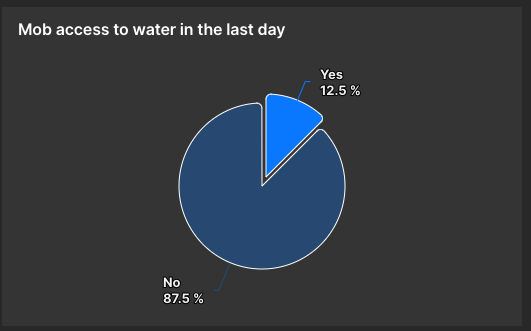
This information is essential is understanding if animals have accessed water
For specific animals, users can now know if they are actively accessing water and if they are not - no more guessing!
For intense weather days, this is crucial information for any health concerns
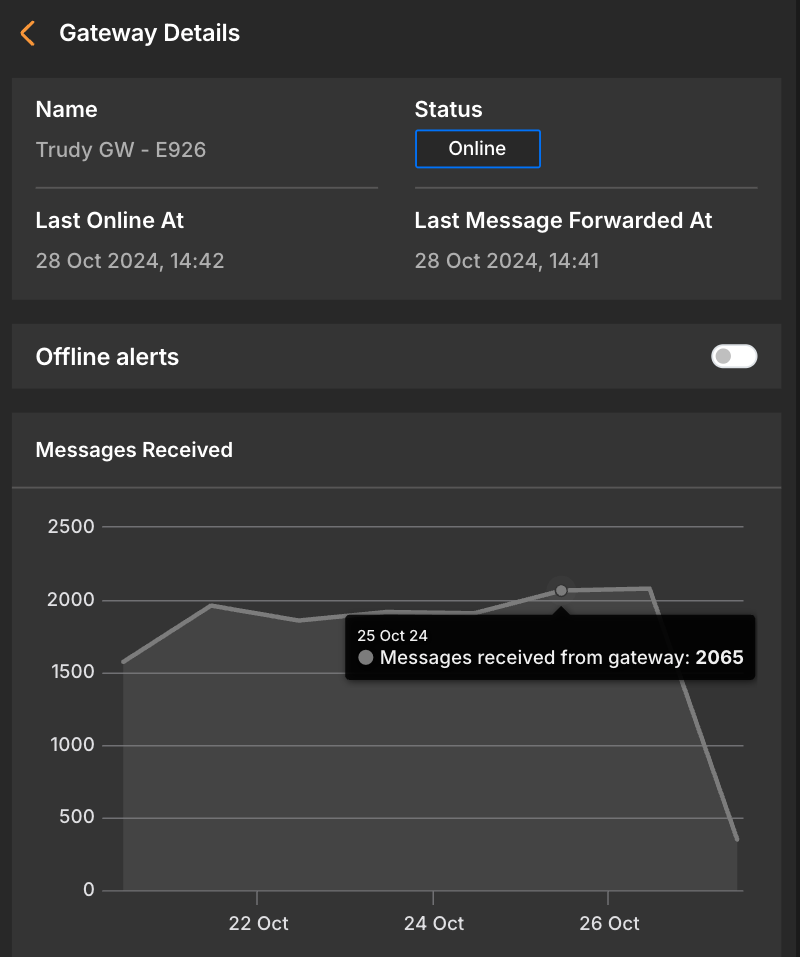
Gateways
The gateways tab shows the status of gateways on the property. If the tags stop communicating, a good place to start troubleshooting is to check this status and ensure that gateways are online.
Gateways need phone reception, though tags do not. So the best point of call is to have the gateways as high as possible, be it on a tall mast, windmill, shed, mountain etc… this way it can look over anything. By having a line-of-sight, they will be able to communicate and transmit the data over to users.
The gateways do not weigh much (less than 2kg) and we will assist in guidance for best location.
Gateways for simplicity on the user end are either online or offline.
.png?inst-v=e98c0220-50dc-4e94-b9d9-5faf1971e3bc)
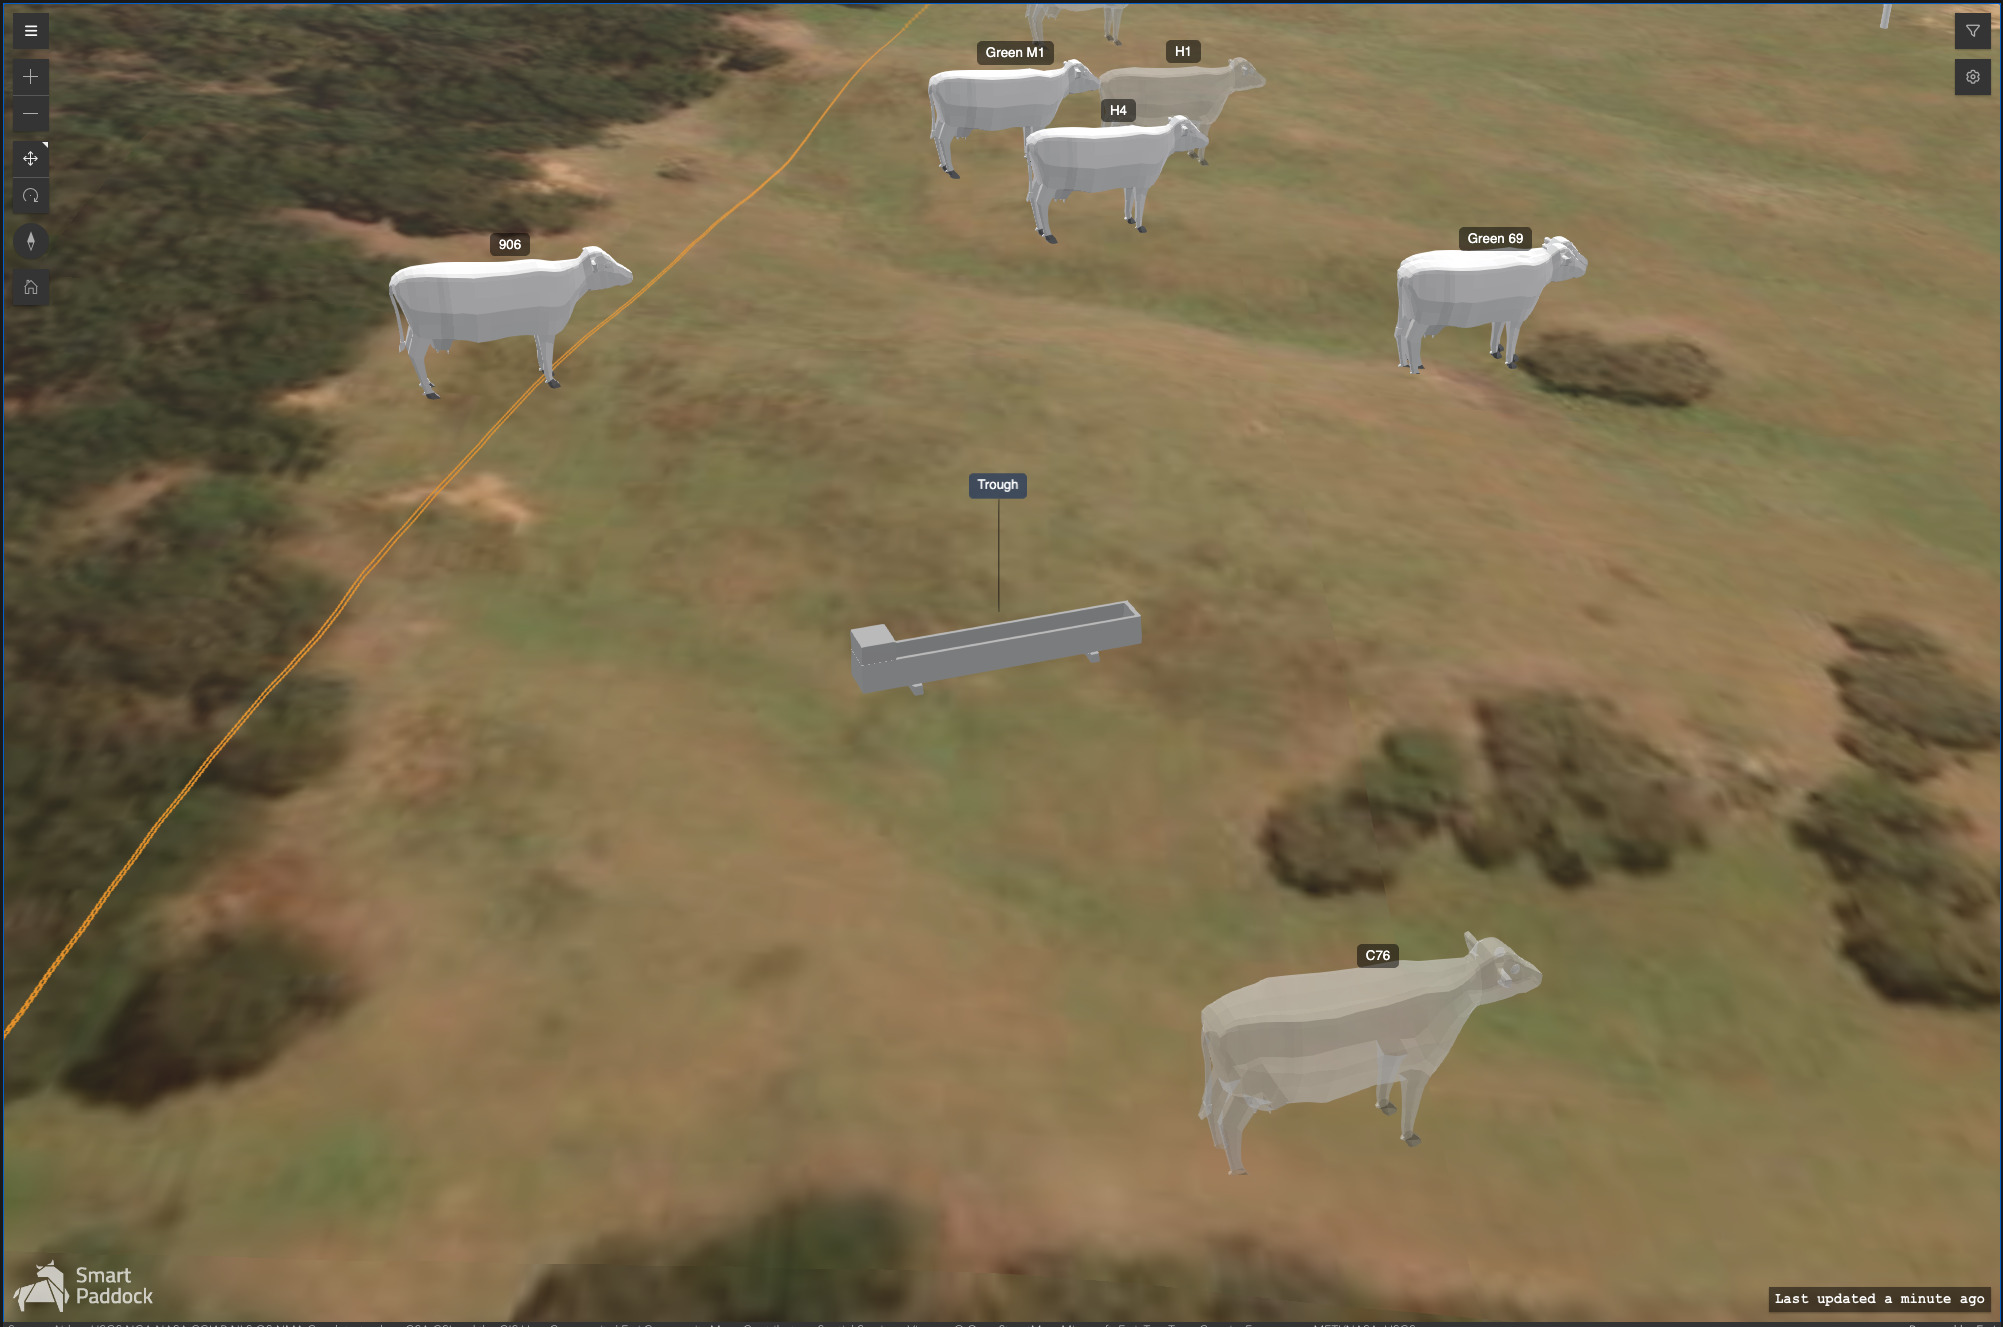
Points of interest
Various points of interest and their locations can be added to a paddock:
Dam
Trough
Open water
Shade
Lick
Other
The interaction between these points of interest and tagged animals is tracked, to assist with behavioural analysis. eg: access to water
Points of interest on the map can be changed at any time and can be seen in isolation.
Sensors
Fence voltage sensor
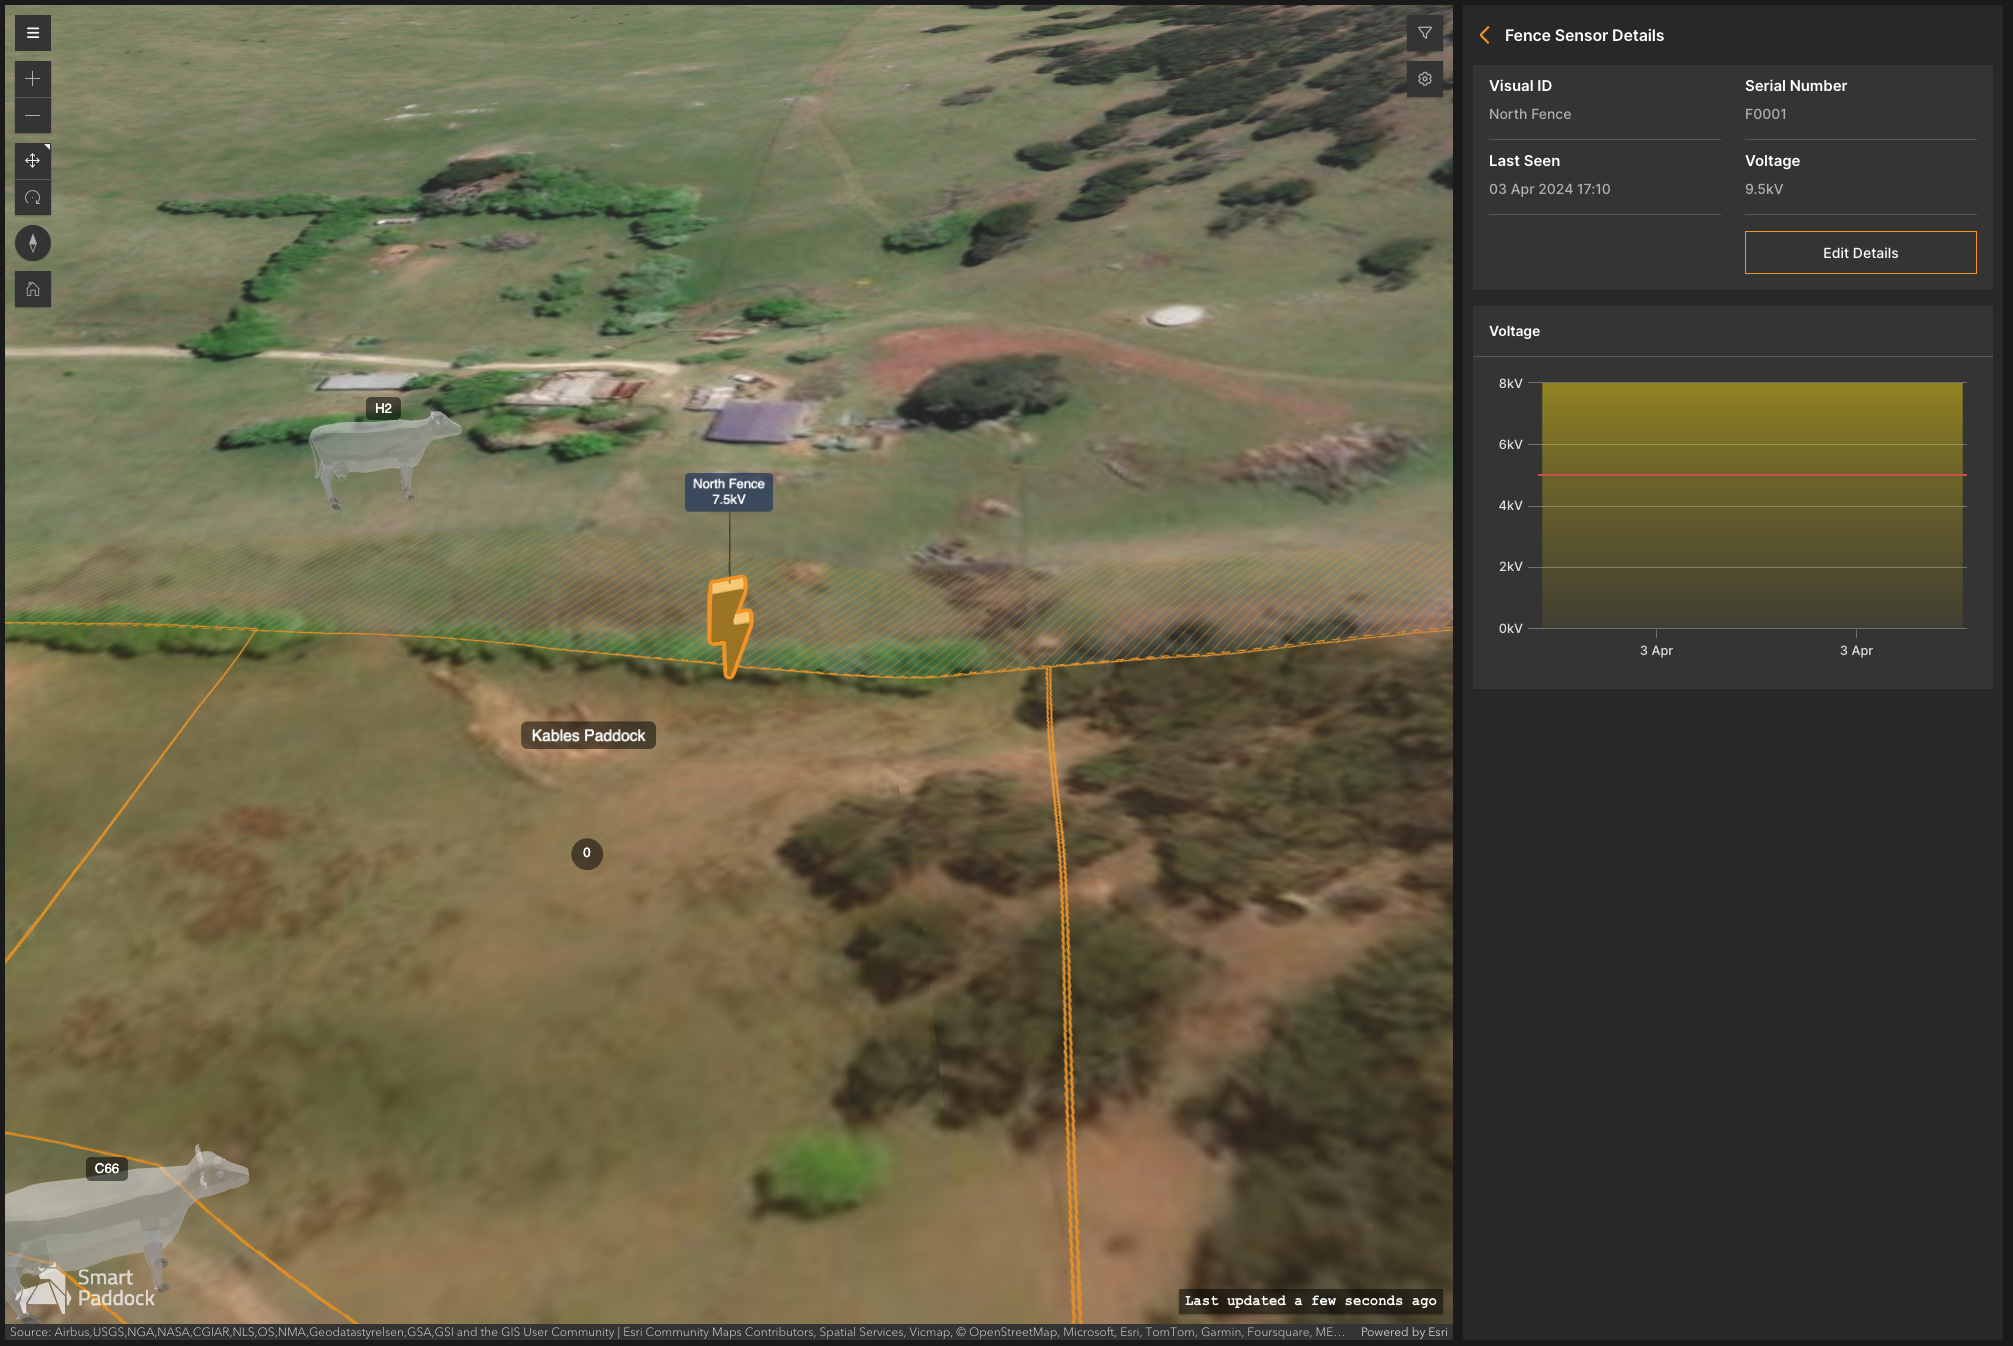
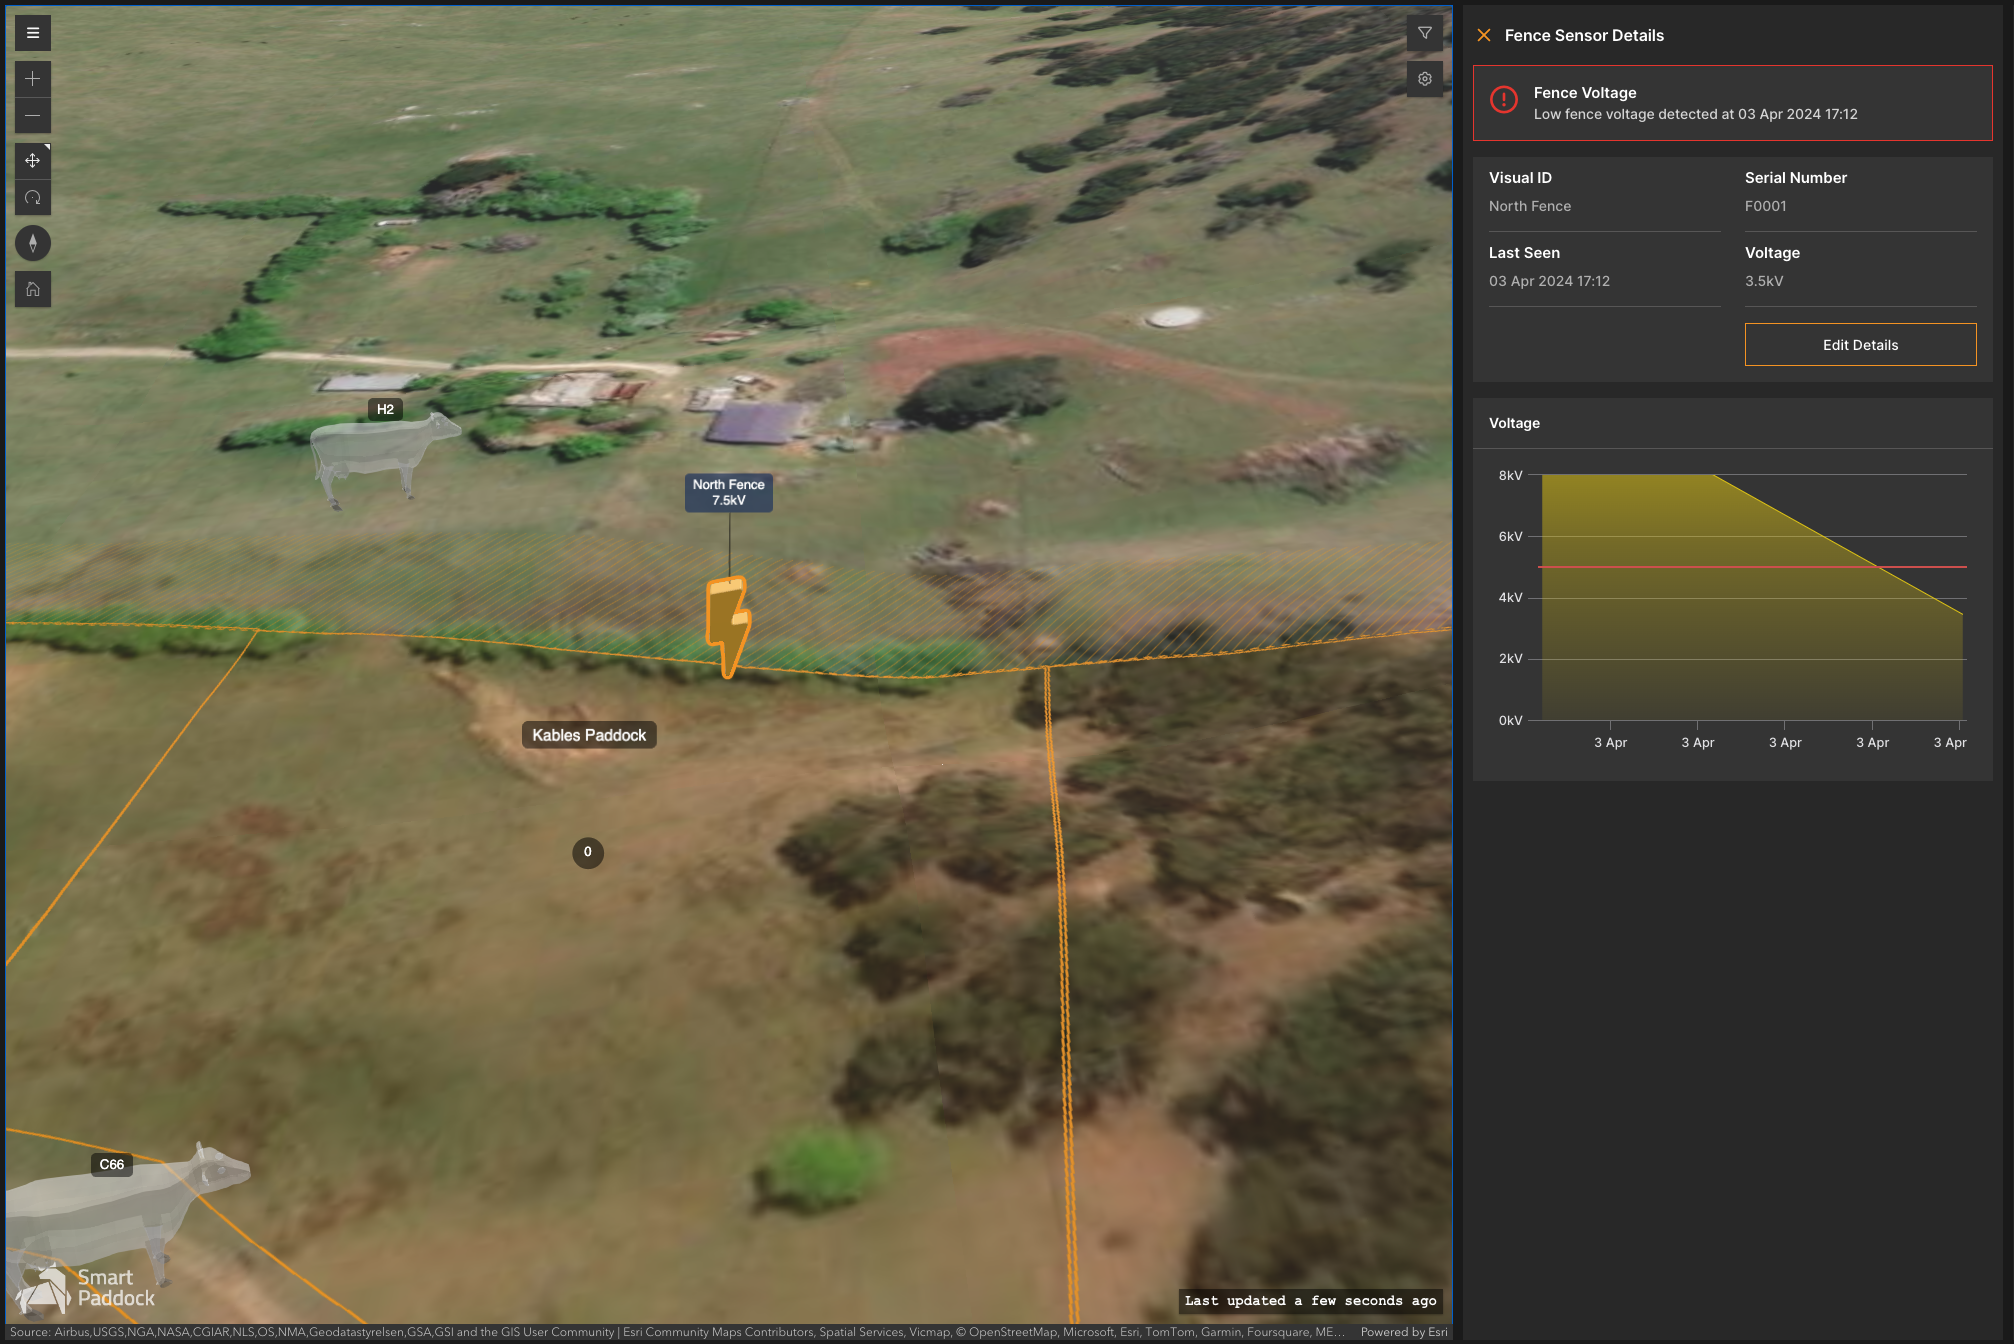
The fence sensor will trigger an alert if the voltage drops below a determined threshold.
In this tab users can view sensor details, including visual ID, sensor voltage, when it was last seen and the status
Users can also search for a specific fence sensor, for example if there has been a broken fence or theft, it can be narrowed down efficiently
Clicking on a fence sensor shows the full details of the sensor and its performance over time
Low voltage alerts are triggered when the voltage level drops below a pre- configured threshold for the particular sensor
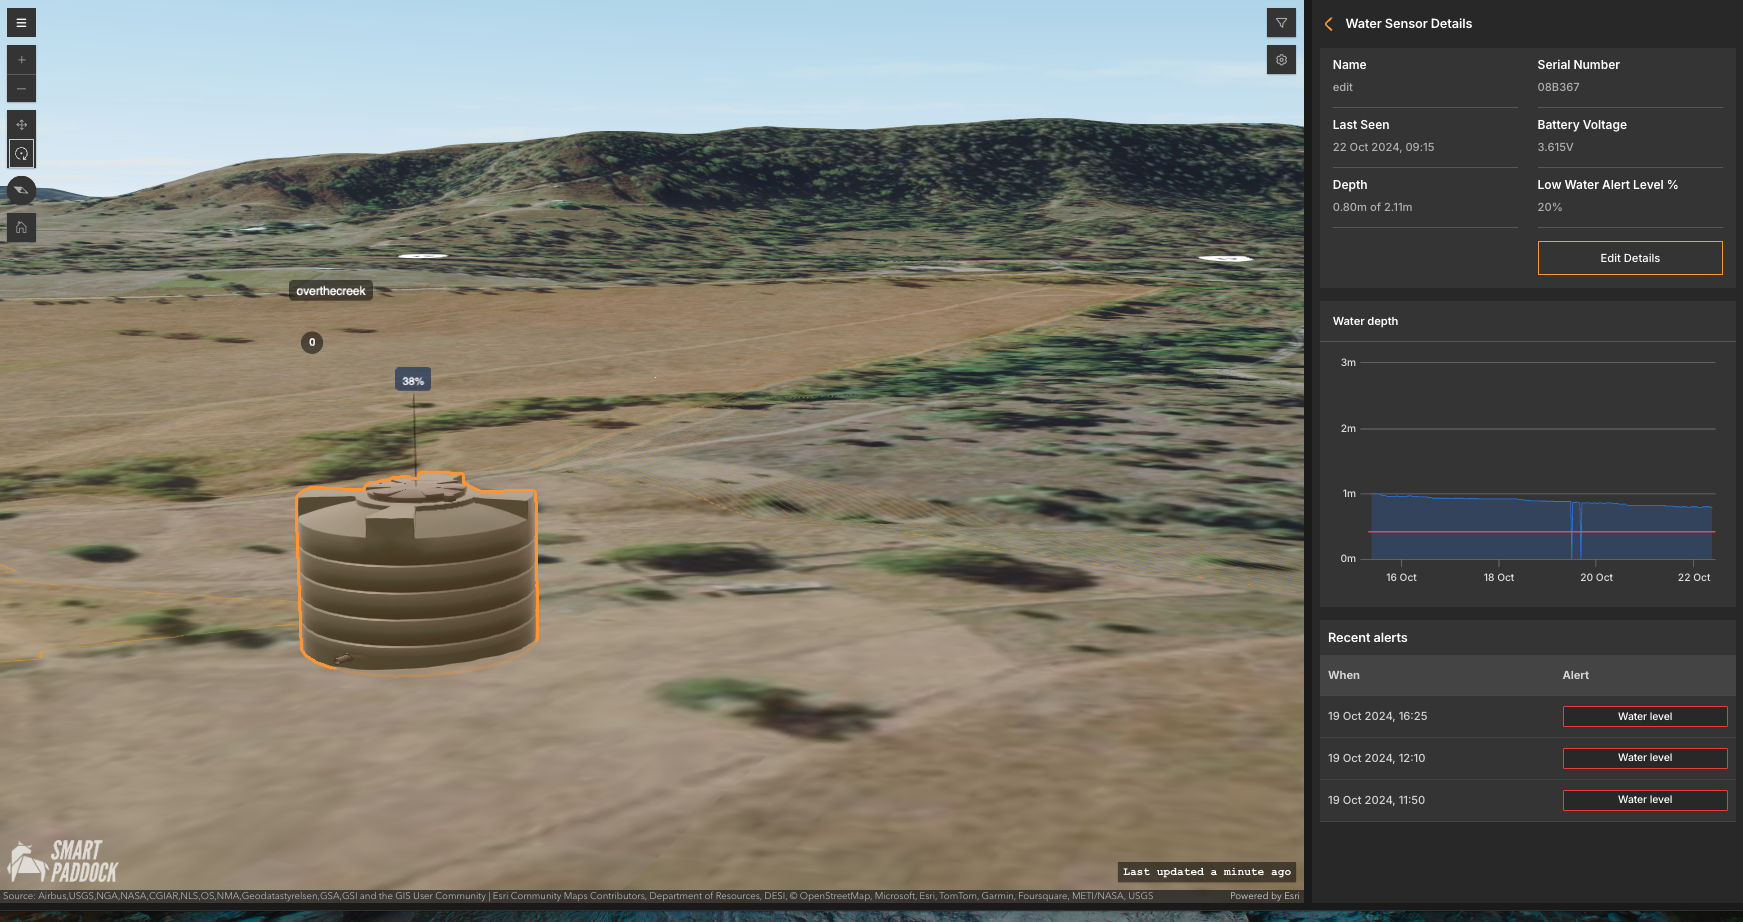
Water sensors
Water sensors are monitored through my ID, % full, when it was last seen and the status
Clicking on a water sensor shows the full details of the sensor and water depth over time
Low water level alerts are triggered when the water level drops below 10% of the total capacity of the water tank, and this threshold is visible on the water depth chart
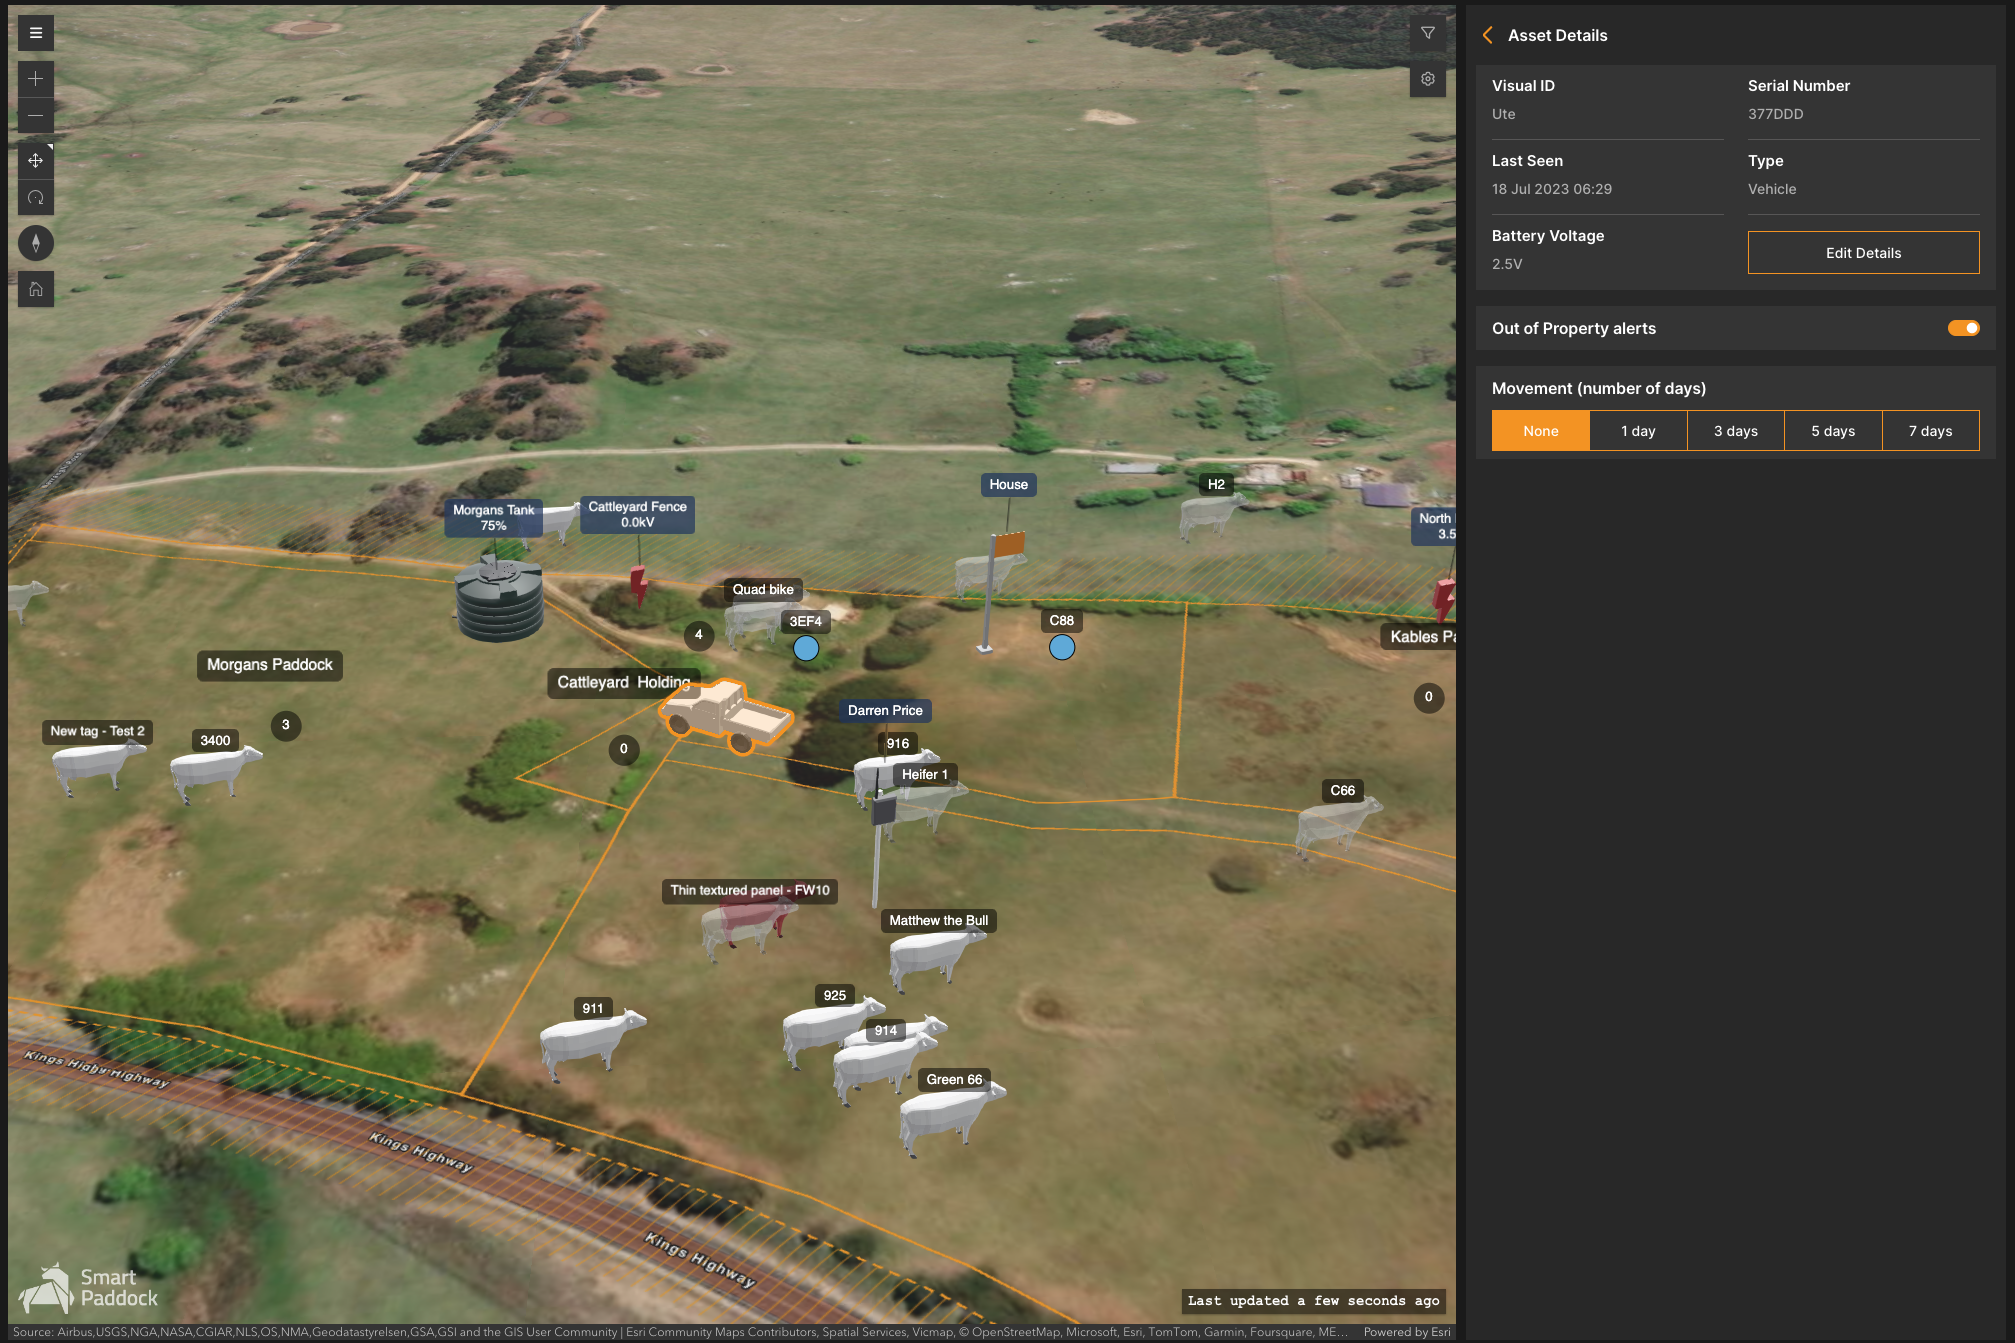
Asset tracker
The asset tracker can be affixed to any asset where location tracking is required. Typically, farm equipment like utes, quads and other mobile assets are tagged.
Current location
Historic locations (up to 7 days)
Property stray alerts, should the asset leave the property boundary.
Upcoming features
TBA